

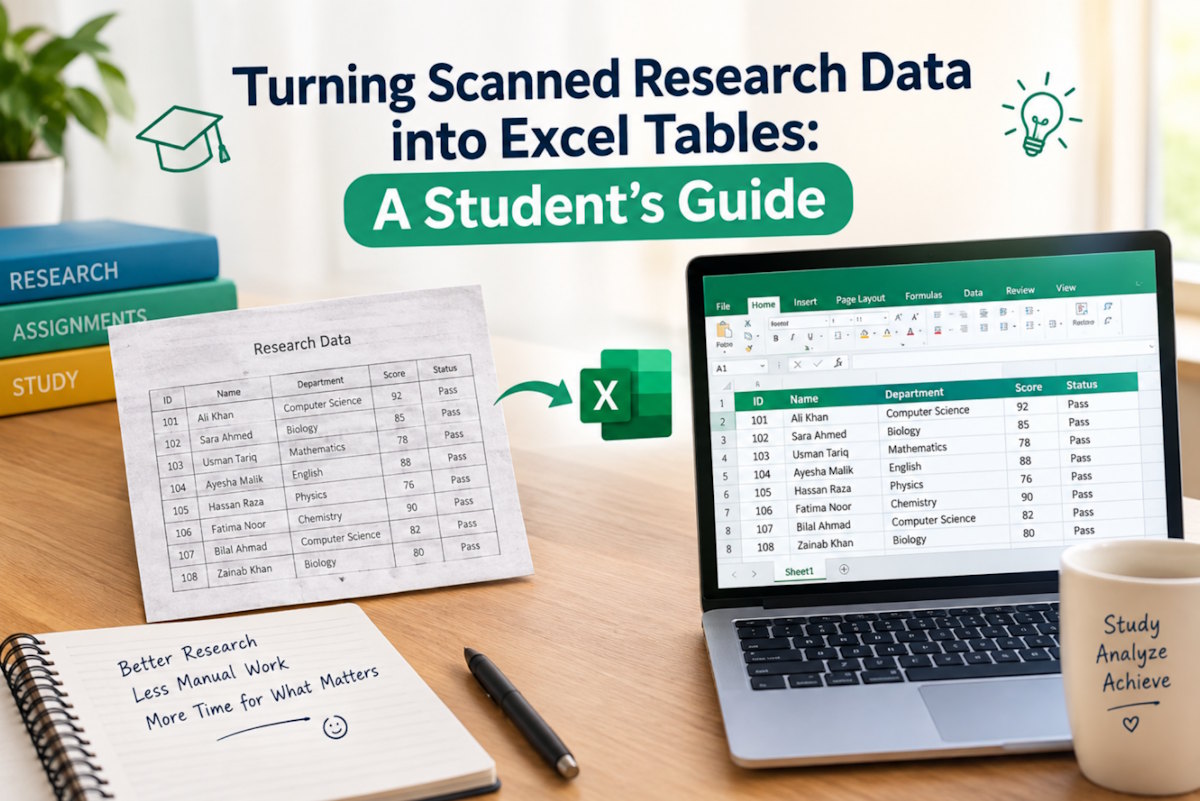
Research doesn’t always come in neat digital formats. Sometimes it’s a photocopied table from a 1998 journal, a photographed page from a library reference book, or a screenshot of a dataset a professor shared in a PDF that won’t let you copy text. For students working on theses, lab reports, or literature reviews, this is one of the most frustrating and time-consuming parts of the research process: manually retyping rows and columns of numbers, hoping you don’t make a transcription error that throws off your entire analysis.
This is where JPG-to-Excel conversion tools have quietly become one of the most useful additions to a student’s research toolkit. Instead of spending hours retyping data, you can scan or photograph a table, run it through an image-to-Excel converter, and have a working spreadsheet in minutes.
A few common scenarios push students toward scanned or photographed data:
In all these cases, the data exists; it’s just trapped inside an image instead of an editable format.
Traditionally, students had two options: retype the entire table by hand, or copy-paste from a PDF and spend just as long fixing the broken formatting that copy-paste usually produces (merged cells, missing decimal points, columns that don’t line up). Both approaches are slow, and both are error-prone, especially with tables that have 50+ rows of numerical data.
A modern picture-to-Excel workflow changes this. Optical character recognition (OCR) combined with table-structure detection can read a photographed or scanned table and reconstruct it as an actual spreadsheet, with rows, columns, and values in the right cells, ready for formulas and analysis.
A master’s student working on a public health literature review needed to compare mortality statistics across 14 studies, several of which were only available as scanned PDFs from a university archive, some dating back to the early 2000s, before digital publishing was standard. Manually retyping these tables was estimated to take roughly 8–10 hours based on the pace of her first two tables.
Instead, she photographed each scanned page with her phone and ran them through an image-to-Excel converter. The tool reconstructed each table’s structure automatically, and she spent the time she saved on verifying figures against the originals instead of typing them from scratch. What would have taken most of a weekend was reduced to a single afternoon, and because she still manually checked every value, the accuracy of her final dataset didn’t suffer; the tool handled structure and speed, and she handled quality control. This let her spend the freed-up time on actually analyzing trends across studies rather than on data entry.
This kind of workflow is increasingly common among graduate students who work with historical or archival data: the tool does the heavy lifting of structure recognition, and the researcher focuses on accuracy and interpretation, which is where their expertise actually matters.
Is it safe to convert JPG to Excel for confidential or unpublished research data? Reputable tools process files securely, but if your data is sensitive or unpublished, check the tool’s data retention and privacy policy before uploading, and consider using an offline OCR option if your institution requires it.
Can I convert jpg to excel from a handwritten table? Yes, though accuracy is lower than with printed text. Clear, well-spaced handwriting converts reasonably well; messy or cursive handwriting usually needs manual correction afterward.
Will the formulas or merged cells from the original table carry over? No, converters extract visible values and structure, not underlying formulas. If the original table had calculated totals, you’ll need to re-add formulas in Excel after conversion.
What’s the best image quality for converting a picture to Excel accurately? A sharp, well-lit, straight-on photo or a 300 DPI scan gives the best results. Avoid glare, shadows, and skewed angles, as these are the most common causes of misread values.
How do I extract tables from image files that contain both text and tables on the same page? Cropping the image to isolate just the table before uploading significantly improves accuracy, since the converter won’t try to interpret surrounding paragraphs as table data.
Is this faster than just retyping a small table myself? For very short tables (under 10 rows), manual typing may be just as fast. The real time savings appear with longer tables, multiple tables, or when converting several documents at once.
For students, time is often the scarcest resource in the research process and manually transcribing scanned tables is one of the least productive ways to spend it. Learning to reliably convert jpg to excel isn’t just a technical shortcut; it’s a research skill that saves hours across a thesis, a literature review, or a semester’s worth of lab reports, while still leaving room for the careful verification good research demands.